Chart of the Day - September Feeder Cattle
The information and opinions expressed below are based on my analysis of price behavior and chart activity
Tuesday, August 12, 2025
If you like this article and would like to receive more information on the commodity markets from Walsh Trading, please use the link to join our email list -Click here
Every morning, at about 8 AM CST, I post a short video highlighting where I see opportunities in the futures markets. You can view my most recent video here
September Feeder Cattle (Daily)
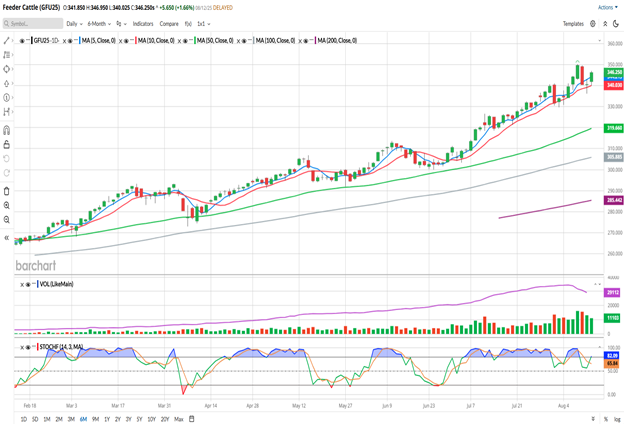
Today, the September Feeder Cattle closed at 346.200, up 5.65 from Monday. The trade is still currently in the “shadow” of last Friday’s limit down close. So far this week, the chart seems to be very similar to was seen at the end of July. On the 31st, Feeders dropped aggressively, but 5 sessions later they were making new highs. I don’t know if it will take 5 days this time, or if it will happen at a quicker pace, but based on the start of this week, I would expect that pattern to continue. It could take until next week, or perhaps not occur at all. Stay tuned to find out! At this moment, I’m still bullish.
Monday’s trade, in my opinion, was somewhat neutral. A small gain at the close, but more of an equilibrium day, I think. The close was just a few ticks higher than where it opened. The bears won out early in the day, extending lower from Friday’s losses, but the bulls came back and we settled the day with no clear winner. Today’s trade had a firm bias until the USDA Grain report came out at 11 AM. Due to the sharp increase in the estimates for the Corn crop, the rally began in earnest after that.
The close of the day was above yesterday’s high. To my eye, that’s a directional close and points to higher prices. 350.200, last week’s high and the contract high, seems like a reasonable target from here and beyond that to 355.000 or 360.000. A simple trendline drawn across the July 11-Aug 7 highs projects to 360.000 sometime next week, should the trend continue.
The 5- and 10-day moving averages (blue,red) are below the market now, offering potential support levels near 344.215 and 340.030, respectively. The 50-, 100 and 200-day averages (green, grey and purple) are well below the market and not currently “in play” to me. Stochastics (lower subgraph) hooked higher with today’s trade and are pointing up. Keep in mind, this market hasn’t had a decent retracement, pull back or sideways consolidation since the middle of June. Many people tell me that they think the market is overdue to head lower. The technicals that I watch (and the fundamentals) aren’t showing me that just yet.
Aggressive and well margined traders may do well to consider long futures positions. Perhaps looking at support near the 5-day average (344.200 ish) or Monday’s high near 343.100. Your risk (and potential reverse) is near Monday’s low of 336.175, but that may be a little steep for some folks, so I’ll leave the risk up to you.
Less aggressive traders may do well to consider using options, perhaps a call spread. The September 350/360 calls settled at difference of 3.30 today. Perhaps an entry near 3.00 ($1500 before commissions/fees) would be a good choice. Place a GTC order to take a profit at 2x what you paid for that spread.
If you like what you’ve read here and would like to see more like this from Walsh Trading, please Click here and sign up for our daily futures market email.
Every morning, at about 8 AM CST, I post a short video highlighting where I see opportunities in the futures markets. You can view my most recent video here
September Feeder Cattle (Monthly)
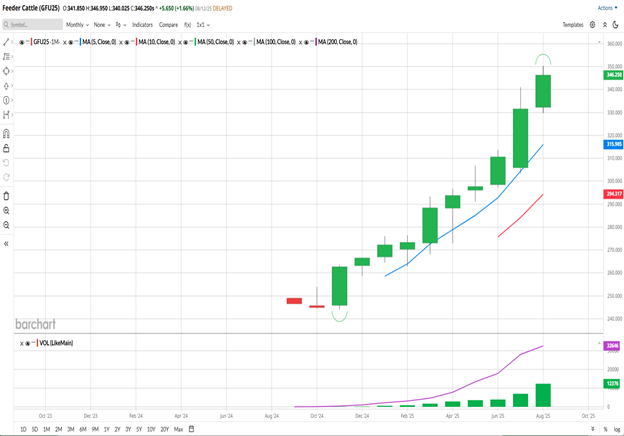
Instead of the weekly chart that I would normally put here, this week I’ve chose the monthly chart. It’s a short view, as the Feeder contracts only go about 1 year out. There are 12 bars (months) on the chart above. The first 2 were red or down months. The last 10 have been positive. Since the contract low was set in November of last year, this market has set new highs every month. Even the Live Cattle had a down month (Feb 25) during that period. But Feeders keep heading higher. And this chart is showing no signs, currently, of slowing down.
If you like what you’ve read here and would like to see more like this from Walsh Trading, please Click here and sign up for our daily futures market email.
Every morning, at about 8 AM CST, I post a short video highlighting where I see opportunities in the futures markets. You can view my most recent video here
Jefferson Fosse Walsh Trading
Direct 312 957 8248 Toll Free 800 556 9411
jfosse@walshtrading.com www.walshtrading.com
Walsh Trading, Inc. is registered as a Guaranteed Introducing Broker with the Commodity Futures Trading Commission and an NFA Member.
Futures and options trading involves substantial risk and is not suitable for all investors. Therefore, individuals should carefully consider their financial condition in deciding whether to trade. Option traders should be aware that the exercise of a long option will result in a futures position. The valuation of futures and options may fluctuate, and as a result, clients may lose more than their original investment. The information contained on this site is the opinion of the writer or was obtained from sources cited within the commentary. The impact on market prices due to seasonal or market cycles and current news events may already be reflected in market prices. PAST PERFORMANCE IS NOT NECESSARILY INDICATIVE OF FUTURE RESULTS. All information, communications, publications, and reports, including this specific material, used and distributed by Walsh Trading, Inc. (“WTI”) shall be construed as a solicitation for entering into a derivatives transaction. WTI does not distribute research reports, employ research analysts, or maintain a research department as defined in CFTC Regulation 1.71.