
VIX Futures in Contango: What to Know
By Brett Friedman, Winhall Risk Analytics/OptionMetrics Contributor
The VIX, the market’s so-called “fear gauge,” has been steadily declining since it peaked at 60.13 last April 8th. The uncertainties facing economic policy, as well as the overall pessimism regarding current and future economic conditions, have prompted many to ask whether the VIX is bound to increase. VIX futures may point to the answer.
Before beginning, it should be noted that the average VIX for this year is not unusually low. Since 1996, only 13 years had a higher average. This year’s highest settlement, 52.33, was higher than only three years in the period reviewed (2008, 2009, and 2020). In addition, summer months tend to have depressed VIX levels, with July being on average the lowest month of the year (the highest is October). Historically, this is not an extraordinary year when it comes to the VIX.
However, the VIX doldrums may be coming to an end. Movement in the shape and slope of the VIX futures curve can be indicative of future direction. Since the VIX is cash settled and a financial instrument (as opposed to a commodity that can be stored), the curve is driven by the value of the VIX itself, sentiment, and the direction of the most nearby, and highest volume, contracts.
As can be seen in the chart below, VIX futures may vary between contango (i.e., nearby futures contracts priced lower than later maturities) and the opposite, or backwardation. Contango is the more common condition. The degree of contango or backwardation (the curve’s slope) can vary considerably, and is correlated to the level of the VIX itself. At extreme levels, it can sometimes portend a change in the VIX’s direction.
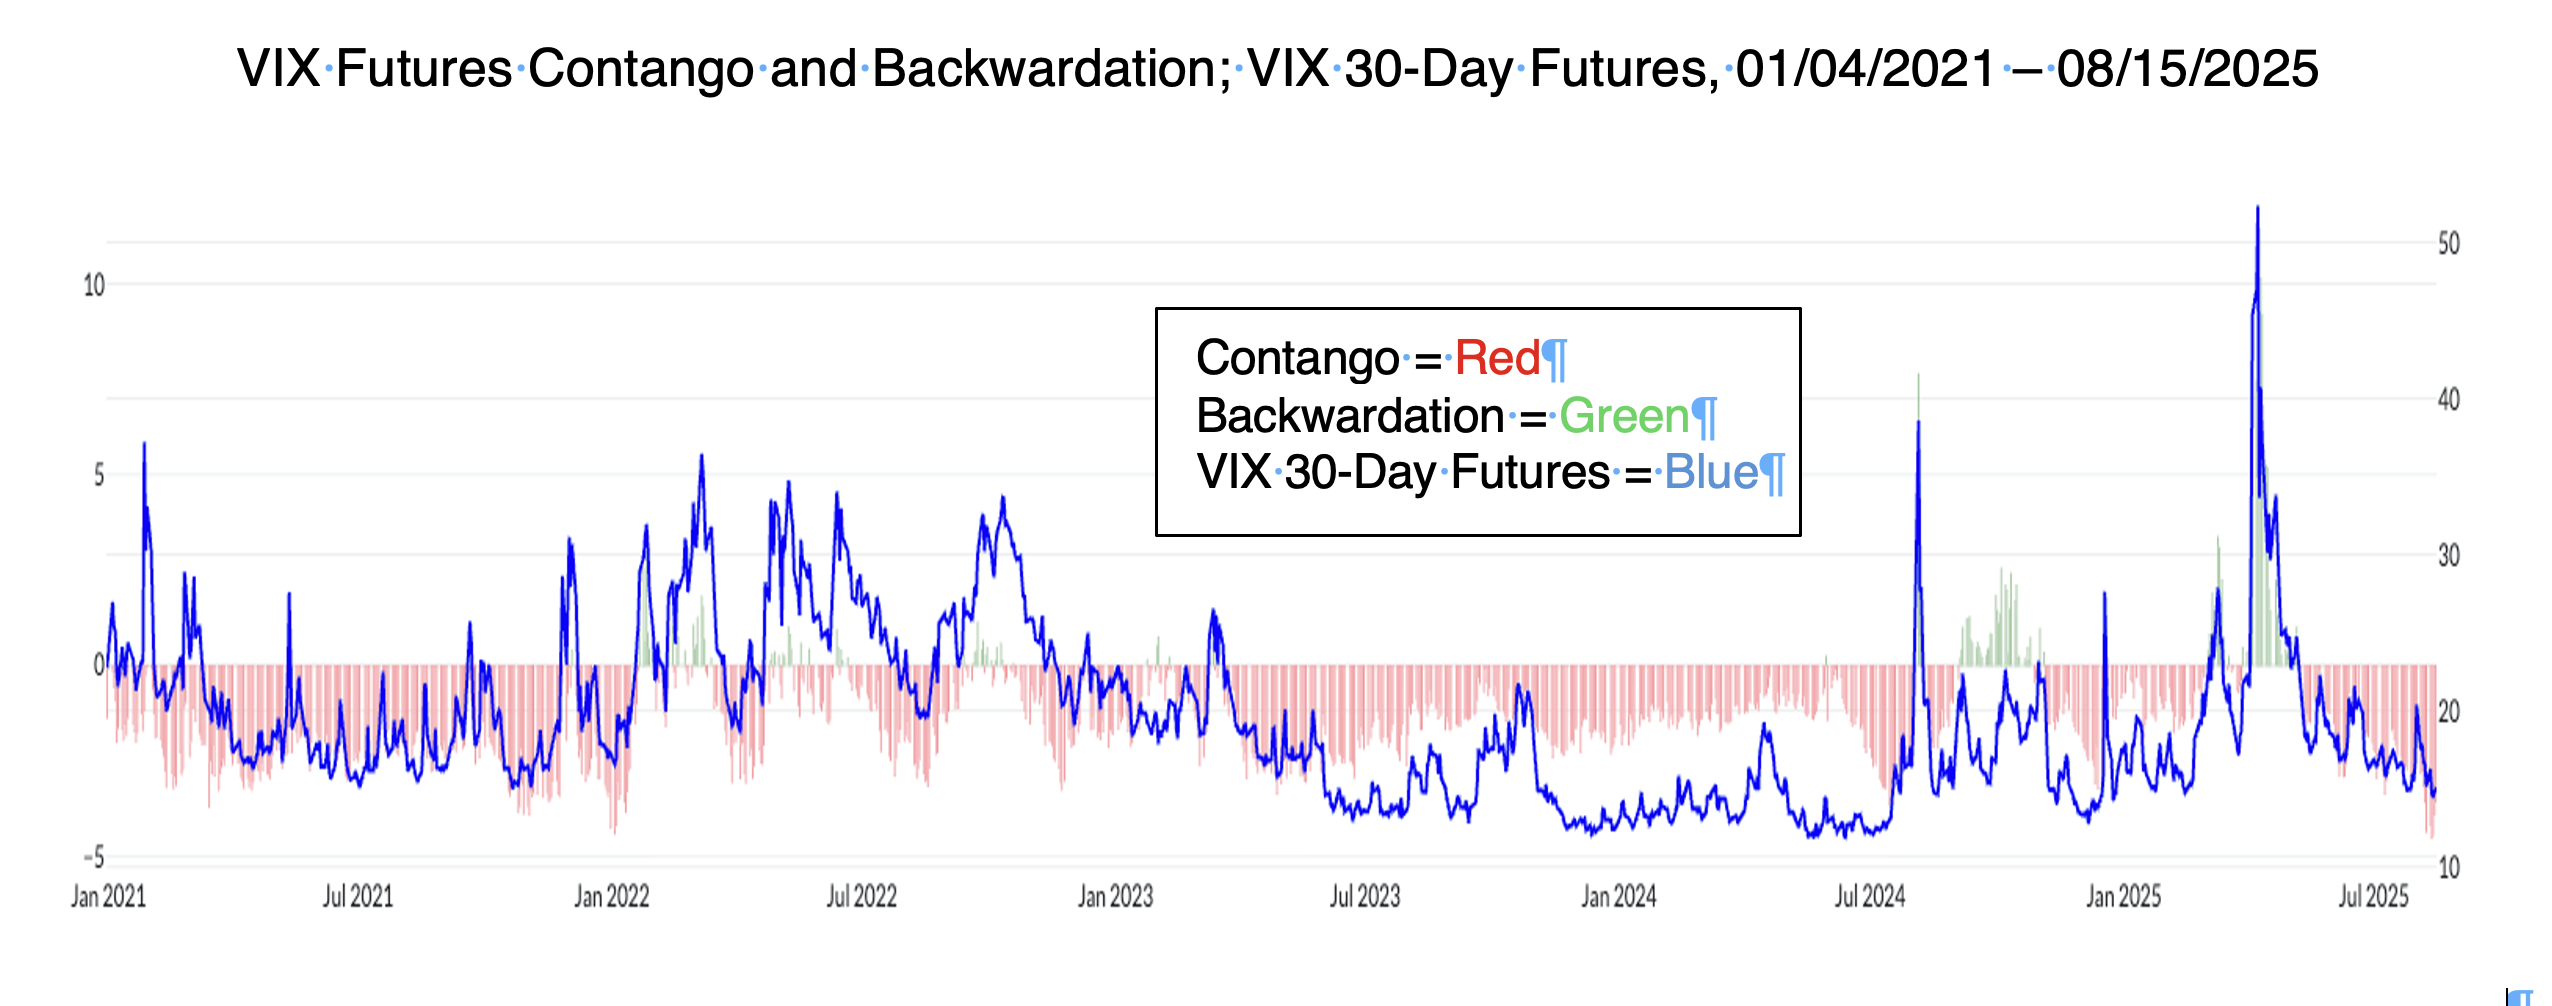
Source: OptionMetrics
During the height of the tariff fears last May and June, the curve moved into backwardation. This is shown as the green values in the chart below:
VIX Futures, 30-Day/182-Day Continuous Futures Spread, VIX Index (Blue), 02/03/2025 – 08/15/2025
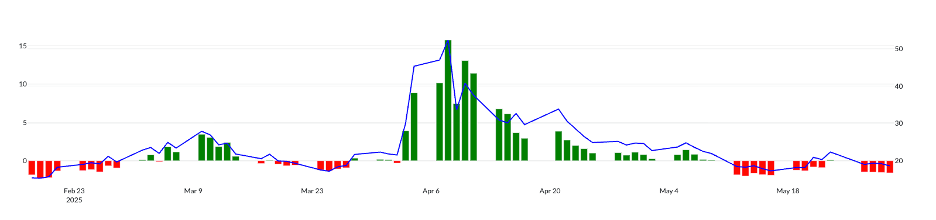
Source: OptionMetrics
For VIX futures, backwardation is rare, and usually only occurs during periods of extreme financial stress. When VIX Futures backwardation first appeared in early-March, it indicated further short-term positive movements in the VIX, and negative returns in the SPX. However, when VIX curve movements and shapes evolve to extreme levels, they can also be harbingers of a possible trend change.
Currently, the curve has the opposite shape – contango – which has been increasing since mid-May. Below, you can see the change in the VIX futures curve from backwardated to contango from May 1 to August 15:
VIX Futures Curves, 05/01/2025 (Gray) vs. 08/15/2025 (Red)
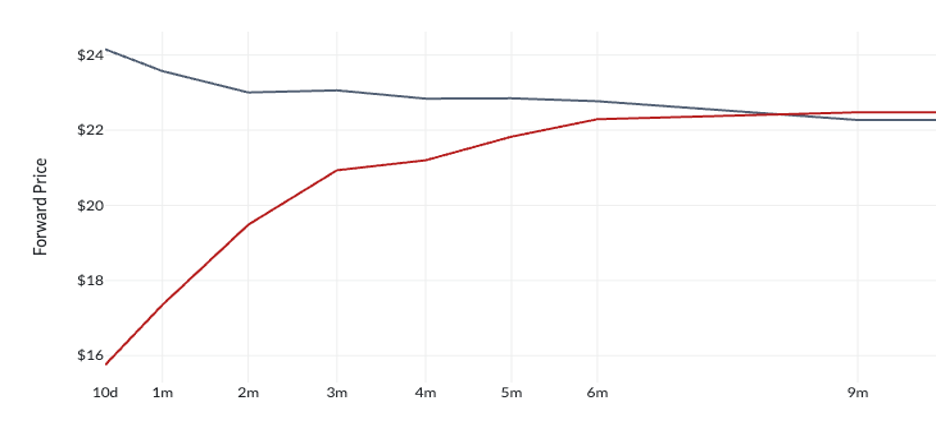
Source: OptionMetrics
In addition, the level of the 6-month to 1-month spread has been increasing since early-May:
VIX Futures Contango Increasing to Extreme Levels
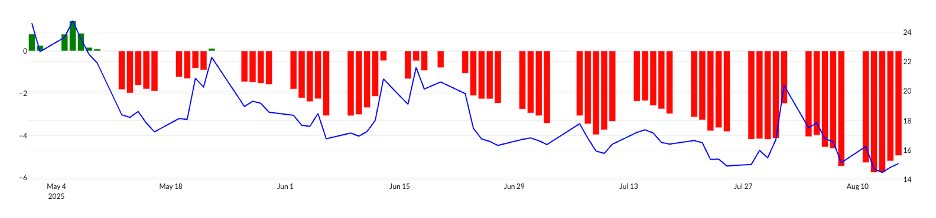
Source: OptionMetrics
At its current level of -4.95, the spread is significantly lower than its long-term average of -2.80, and has been lower than that only 6.9% of the time since February 2006. In addition, and after segmenting VIX levels into brackets, the spread is almost twice as high as the average spread that prevails when the 30-Day VIX future is trading at its current level of 17.35 (see table below):
| VIX 30-Day Futures Range | Average 30-Day – 182-Day Futures Spread |
02/24/2006 – 08/15/2025 | |
| < 12 | -3.42 |
| 12–14 | -2.85 |
| 14–16 | -2.77 |
| 16–18 | -2.54 |
| 18–20 | -2.75 |
| 20–25 | -2.08 |
| 25–30 | -0.83 |
| 30–40 | 2.15 |
| > 40 | 10.59 |
Source: OptionMetrics
What are the implications of the current steep VIX Contango? The natural inclination is to believe that mean reversion will take hold and that the current historically steep VIX contango will eventually snap back to more normal levels. This would imply that the nearby expirations of VIX futures would increase to flatten the curve. A number of outside events could prompt such a move – failure to lower rates, a tech sell off, some “unknown unknown” – it’s impossible to predict. However, although the level of contango is high, that’s not to say that it couldn’t move even higher if no outside event occurs. If that occurs, then the VIX could remain at relatively low levels. Mean reversion can be a notoriously long, and sometimes frustrating, process.
For more insights on the options market and volatility, visit the OptionMetrics blog.
There is an inherent risk involved with financial decisions. The information in this article is for informational purposes only and is not intended to provide financial advice. Views expressed are those of the author and are not necessarily those of the company.